
The idea in brief.
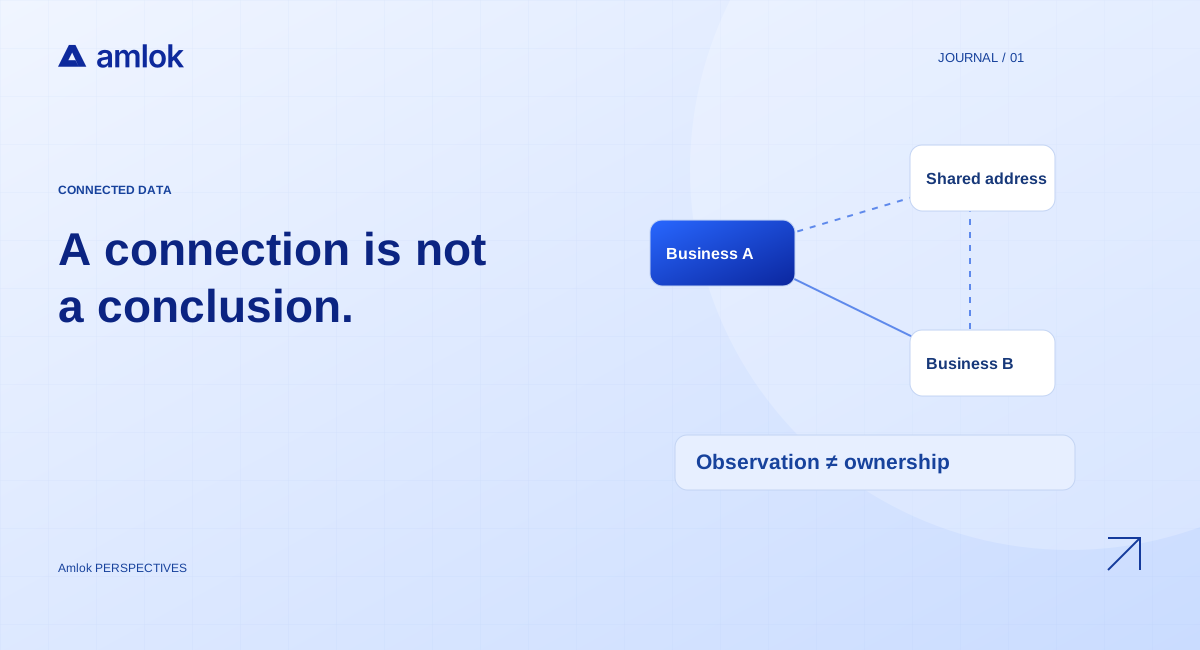
A shared address or a recurring transfer can be a useful lead. It can also be a coincidence, a service relationship, or a data-quality problem. A useful risk graph keeps the observation, the inferred relationship, and the reviewer’s conclusion separate. [1]
- Type every relationship and retain its supporting source.
- Use uncertainty to guide review, not to hide a weak match.
- Test whether relationships improve a defined task before claiming predictive value.
This article describes an evidence-design method. The company examples are hypothetical; no graph-model performance is claimed.
An edge needs a meaning
Imagine two businesses share a registered address. That observation does not establish common ownership. They might use the same professional-services office. A transfer between them also does not establish control: it could be a supplier payment, a loan, or a refund. The graph should store what is directly observed before adding an inferred explanation.
Give relationships explicit types and effective dates. “Shares an address,” “owns,” “guarantees,” and “paid” answer different questions. A source document may establish one of these while merely suggesting another. Preserving those distinctions keeps the diagram from overstating its evidence. [2][1]
The claim becomes more specific at each step
- 01Observation
Two records share a value or event.
- 02Hypothesis
A possible relationship explains the overlap.
- 03Verification
Inspect identity, dates, and source documents.
- 04Decision context
Use the verified link for a specific question.
Confidence belongs to the relationship
It is tempting to attach one confidence score to an entity and treat every connection as equally reliable. That loses information. A company identifier from a registry may be strong evidence of identity while an ownership inference from transaction descriptions remains weak. Each relationship should carry its own evidence and review state.
W3C’s provenance model offers a useful conceptual reference: data can retain the entities, activities, and agents involved in its production. Applied to a financial graph, that means a reviewer can inspect not only a linked fact but how the link was created. This is a design principle, not a claim that provenance alone proves the fact true. [3]
A false merge can change the analysis
Consider a hypothetical business with CAD 100,000 in obligations and an unrelated business with CAD 300,000. A false identity merge can make the first appear to carry CAD 400,000. The arithmetic is correct; the identity assumption is not. The error can then spread into concentration measures, affordability calculations, and monitoring signals.
The correction path matters as much as the initial match. Preserve the original records, the matching rule, and the derived calculations affected by a reversal. Reviewers should be able to split an entity and recompute the view without deleting the history of why the earlier result appeared. [2]
Measure the benefit of the connection
A predictive graph claim needs a comparison against the same records without the relationship features. Separate connected groups across evaluation partitions where relevant, and inspect false merges and missed links independently. Otherwise a model may appear strong because related records leaked across the split. [4]
Amlok’s published research includes structured-loan and document-retrieval baselines; those experiments do not establish graph-model lift. The next credible result is a controlled comparison with clear entity rules and a defined outcome. Until then, a graph’s defensible value is making relationships and questions reviewable. [5]
Sources & methodology.
Figures identify their population, period, and units. Scenarios marked illustrative are Amlok calculations using stated assumptions, not observed customer outcomes.
- 1Entity and relationship graphAmlok research and product documentation
Research design for provenance, entity resolution, relationship types, and uncertainty.
- 2Financial record modelAmlok research and product documentation
Proposed representation of source, entity, amount, period, event time, and knowledge time.
- 3An overview of the PROV family of documentsW3C · 30 April 2013
Conceptual grounding for recording the entities, activities, and agents behind data. Not a claim of Amlok standards certification.
- 4Evaluation designAmlok research and product documentation
Evaluation protocols and research objectives. A specified protocol is not evidence that an experiment has been completed.
- 5Research model cardAmlok research and product documentation
Intended uses, exclusions, status of model development, and limits to generalization.