Amlok

The idea in brief.
A risk graph becomes useful when its relationships can be traced, its claims tested, and its uncertainty inspected. Amlok’s research release 0.3 supplies two starting points: supervised learning on structured US loan records and evidence retrieval from financial reports. Together they establish reproducible baselines; they do not establish an end-to-end underwriting model. [1]
- The held-out SBA cohort contains 11,996 observations and 210 reported charge-offs within the defined horizon. [1]
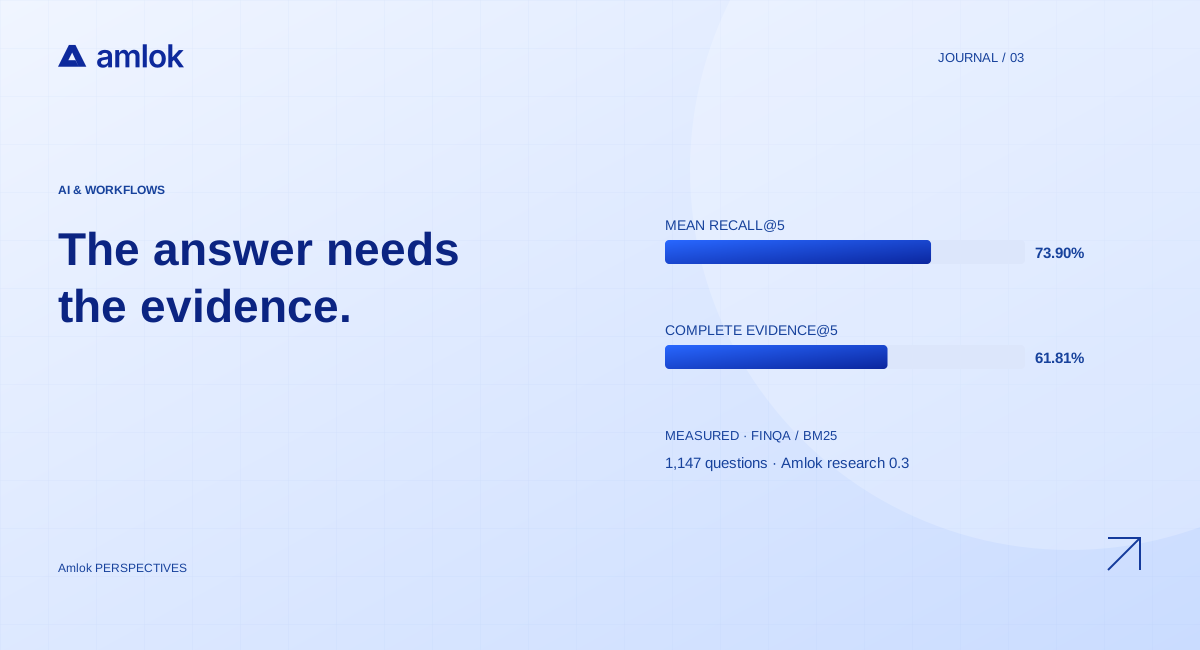
- BM25 retrieves all annotated evidence within five candidates for 61.81% of FinQA questions. Evidence retrieval remains a material bottleneck. [1]
- A reliable research programme needs point-in-time data, independent cohort checks, and prospective workflow evaluation before a production-performance claim.
This report synthesizes published Amlok experiments and their downloadable artifacts. Its scope is public SBA loan records and financial-report evidence, not private-lender outcomes or an end-to-end product validation. Dataset inventories retain their source-specific units, and proposed graph methods remain separate from measured baselines. [2][3]
Start with the unit of evidence
A transaction, a financing announcement, and an annual-report fact answer different questions. Joining them can create context; counting them together can create a misleading impression of scale. The first research obligation is to preserve the original unit and the conditions under which it was observed.
Amlok’s inventory includes 2,207,426 SBA loan-program rows and 208,818 New York mortgage originations from the 2024 HMDA slice. The Canadian disclosure collection contains 1,049 rows, while the SEC source contains 3,905,397 numeric facts. None of these totals is interchangeable with unique borrowers, funded facilities, or validated closed deals. HMDA origination records do not supply subsequent repayment outcomes. [2]
The proposed graph should therefore retain typed relationships: an entity owns an account, a facility funds a borrower, a statement reports a balance. Each relationship needs evidence and dates. Entity resolution should attach a confidence and review state rather than silently merging similar names. Provenance is a useful organizing principle because it preserves how a claim was produced, not just its latest value. [4][5]
From source to reviewable claim
- 01Observe
Keep the original record, units, and source date.
- 02Resolve
Link entities with a confidence and review state.
- 03Compute
Version definitions, transformations, and assumptions.
- 04Review
Present the conclusion with evidence and limits.
Define a narrow, observable target
The supervised experiment asks whether an eligible SBA observation has an SBA-reported charge-off within 36 calendar months of first disbursement. This is deliberately narrower than every economic definition of default. A late payment, a restructuring, and a charge-off are different events; replacing one with another changes the task.
The cohort is an approximately 10% deterministic record-hash sample of eligible funded-status observations approved between 2010 and 2016, taken from the 30 September 2026 source snapshot. Invalid dates, unknown statuses, missing required amounts, and charge-off records without outcome dates are excluded. Those choices improve interpretability but also define a selected population. [1]
Training uses 2010–2013 approvals, validation uses 2014, and evaluation uses 2015–2016. Exact normalized name/state groups appearing earlier are removed from later partitions. That reduces obvious overlap but cannot resolve every alias, owner, or related company. Evaluation should therefore describe the remaining entity uncertainty rather than call the split perfectly borrower-independent.
| Partition / approval years | Observations | Positive outcomes | Entity groups |
|---|---|---|---|
| Training / 2010–2013 | 19,135 | 291 | 18,837 |
| Validation / 2014 | 5,264 | 69 | 5,216 |
| Held-out / 2015–2016 | 11,996 | 210 | 11,822 |
Read the metrics together
Logistic regression reaches an evaluation AUROC of 0.72284; histogram gradient boosting reaches 0.71820. AUROC describes ranking across positive and negative observations. It is not an approval accuracy, a probability of repayment, or the proportion of losses avoided. The paired interval for boosting minus logistic regression spans −0.02406 to +0.01278, so this run does not establish a reliable winner. [7]
Average precision is 0.04577 and 0.04267 respectively. The outcome prevalence is 210 ÷ 11,996, or about 1.75%. That context matters for a rare outcome: a model can improve ranking while still presenting many false positives at a chosen operating point. The Brier scores of 0.01706 and 0.01708 should also be interpreted alongside prevalence and a constant-prediction comparator, not in isolation.
Both models use structured fields including approval amount, guarantee fraction, initial interest rate, programme, industry, business-age category, and rate type. They exclude outcome fields and borrower names. However, the current snapshot does not prove that every retained predictor equals its original underwriting-time value. That unresolved availability question limits a prospective interpretation. [1][8]
Ranking performance, with uncertainty
View figure data
| Measure | Value |
|---|---|
| Logistic regression | 0.72284 |
| Gradient-boosted trees | 0.71820 |
Test the evidence before testing the answer
The second experiment evaluates lexical retrieval on all 1,147 FinQA test questions, drawn from 380 source filenames. Candidates are sentences and table rows from the supplied report. Column headings remain attached to rows. Neither ranker sees the answer, reference programme, gold evidence identifiers, or the dataset’s pre-existing retrieved inputs. Gold annotations are used only after ranking. [1][9]
TF-IDF and BM25 use the same candidate construction and tokenizer. BM25 uses k1 = 1.5 and b = 0.75; one configuration per method was evaluated, without tuning against test labels. The paired gain in mean Recall@5 is 4.31 percentage points, with a 95% interval of 2.37–6.22 points from 2,000 source-filename bootstrap resamples. Rounded table values yield a 4.30-point subtraction; the reported paired gain uses unrounded scores. [10]
Complete evidence is the stricter operational question. BM25 finds every annotated item within five candidates for 61.81% of questions, leaving 38.19% incomplete by this definition. That complement is a calculation, not a measured answer-error rate. An answer model might fail with complete evidence or succeed using other information; neither outcome was tested here.
Retrieval quality is not answer accuracy
View figure data
| Measure | Value |
|---|---|
| TF-IDF · Recall@5 | 69.60% |
| BM25 · Recall@5 | 73.90% |
| TF-IDF · complete evidence@5 | 57.89% |
| BM25 · complete evidence@5 | 61.81% |
Make the graph hypothesis falsifiable
The next useful question is whether relationships improve decisions beyond the same underlying records. A graph experiment should compare an identical population and feature window with and without relationship features. Freeze the entity-resolution rules before the held-out test and examine false merges separately from missed connections.
Borrower, connected-group, time, and institution splits answer different generalization questions. A temporal split tests a later period. A connected-group split tests separation from known networks. An institution holdout tests transfer across operating contexts. None should be substituted for another without explaining what changed.
For each candidate improvement, predefine a target, horizon, baseline, primary metric, missing-data policy, and uncertainty method. Report results by source coverage and cohort. A lift that exists only for well-connected, long-tenured businesses may not help a new applicant with sparse records. The current published baselines do not measure that lift. [11][3]
- Reconstruct what was available at the decision date, including document publication delays.
- Run ablations for identity links, transaction relationships, and document evidence.
- Inspect calibration and review burden at the institution’s proposed operating points.
- Reserve a prospective period to measure actual workflow outcomes after the research protocol is fixed.
Reproduce first, extend second
The research package links a baseline result manifest and record-level predictions, plus a retrieval manifest, item-level rankings, source analysis, and acquisition records. Reproduction should preserve the dataset snapshot, preprocessing rules, scoring definitions, and seeds. A changed upstream file is a new version of the experiment, even if the URL remains the same. [12]
An institutional pilot should begin with a frozen research specification and a representative authorized dataset. Compare the proposed workflow against the existing process, log overrides, and distinguish time saved from credit outcomes. Review turnaround, evidence completeness, missed events, calibration, and loss experience belong in separate measurements.
The scientific contribution at this stage is a visible evidence trail and honest baselines. The published studies support research into connected risk intelligence. They do not establish a production foundation-model checkpoint, Canadian lending-score validity, or superiority to hosted frontier models. Those are separate claims that need separate experiments. [3]
Sources & methodology.
Figures identify their population, period, and units. Scenarios marked illustrative are Amlok calculations using stated assumptions, not observed customer outcomes.
- 1Real-data training and benchmark resultsAmlok research and product documentation
Research release 0.3. Separate SBA charge-off and FinQA evidence-retrieval experiments; self-reported reproducible research, not independent product validation.
- 2Dataset inventory and acquisition scopeAmlok research and product documentation
Inventory preserves source-specific units: loan-program rows, disclosures, originations, and financial facts. A row count is not a closed-deal count.
- 3Research model cardAmlok research and product documentation
Intended uses, exclusions, status of model development, and limits to generalization.
- 4Entity and relationship graphAmlok research and product documentation
Research design for provenance, entity resolution, relationship types, and uncertainty.
- 5An overview of the PROV family of documentsW3C · 30 April 2013
Conceptual grounding for recording the entities, activities, and agents behind data. Not a claim of Amlok standards certification.
- 6Financial record modelAmlok research and product documentation
Proposed representation of source, entity, amount, period, event time, and knowledge time.
- 7SBA baseline result manifestAmlok · downloadable JSON
Machine-readable cohort, fitting, metrics, and uncertainty. Companion record-level predictions are linked from the results page.
- 8Leakage and the reproducibility crisis in machine-learning-based scienceKapoor and Narayanan · Patterns, 2023
Research on leakage and methodological validity; used to motivate time-aware and entity-aware evaluation.
- 9FinQA: A Dataset of Numerical Reasoning over Financial DataChen et al. · EMNLP 2021
Original benchmark paper. Amlok’s local evidence construction differs from other published evaluation pipelines.
- 10FinQA retrieval result manifestAmlok · downloadable JSON
Machine-readable lexical retrieval results; paired uncertainty uses source-filename clusters.
- 11Evaluation designAmlok research and product documentation
Evaluation protocols and research objectives. A specified protocol is not evidence that an experiment has been completed.
- 12Reproducibility and saved artifactsAmlok research and product documentation
Acquisition, source hashes, cohort construction, predictions, and reproduction instructions.